Performance data analytics
From sensor data to better race decisions
We developed a live analytics platform for a high-performance sailing programme, bringing boat telemetry and race commentary into one place. It turns large volumes of sensor data into performance measures, interactive race tools and searchable answers that sailors, coaches and analysts can use during debriefs and race weeks.
Confidential: the client and the teams remain confidential. This page describes the method, and every team shown in the screenshots is anonymised.
The challenge
Each boat produces hundreds of sensor channels, sampled several times a second, across speed, loads, attitude, wind and boat geometry. Race commentary adds another layer of knowledge, but it is unstructured and difficult to search. On their own, neither source gave coaches a practical way to understand performance, compare decisions or find the explanation behind a result.
What we did
- Built data pipelines that turn raw telemetry into clean, labelled datasets ready for analysis.
- Developed performance models for manoeuvre costs, ideal routing, start-line analysis and local wind forecasts.
- Created an interactive dashboard and a multi-agent AI system that can answer questions using both telemetry and a curated knowledge base.
Approach
1. Make the data usable
We organised the telemetry into three layers: raw, labelled and summarised (bronze, silver and gold). Along the way, signals are cleaned, manoeuvres such as tacks and gybes are detected, and each race is split into meaningful segments. This gives the dashboard and AI system fast access to consistent data without repeatedly processing the original files.
Race, leg and event summary tables, pre-computed
Smoothed signals; every tack, gybe and rounding detected and segmented
Raw files in a queryable format, no business logic
Hundreds of channels, several samples a second
2. Turn data into performance insight
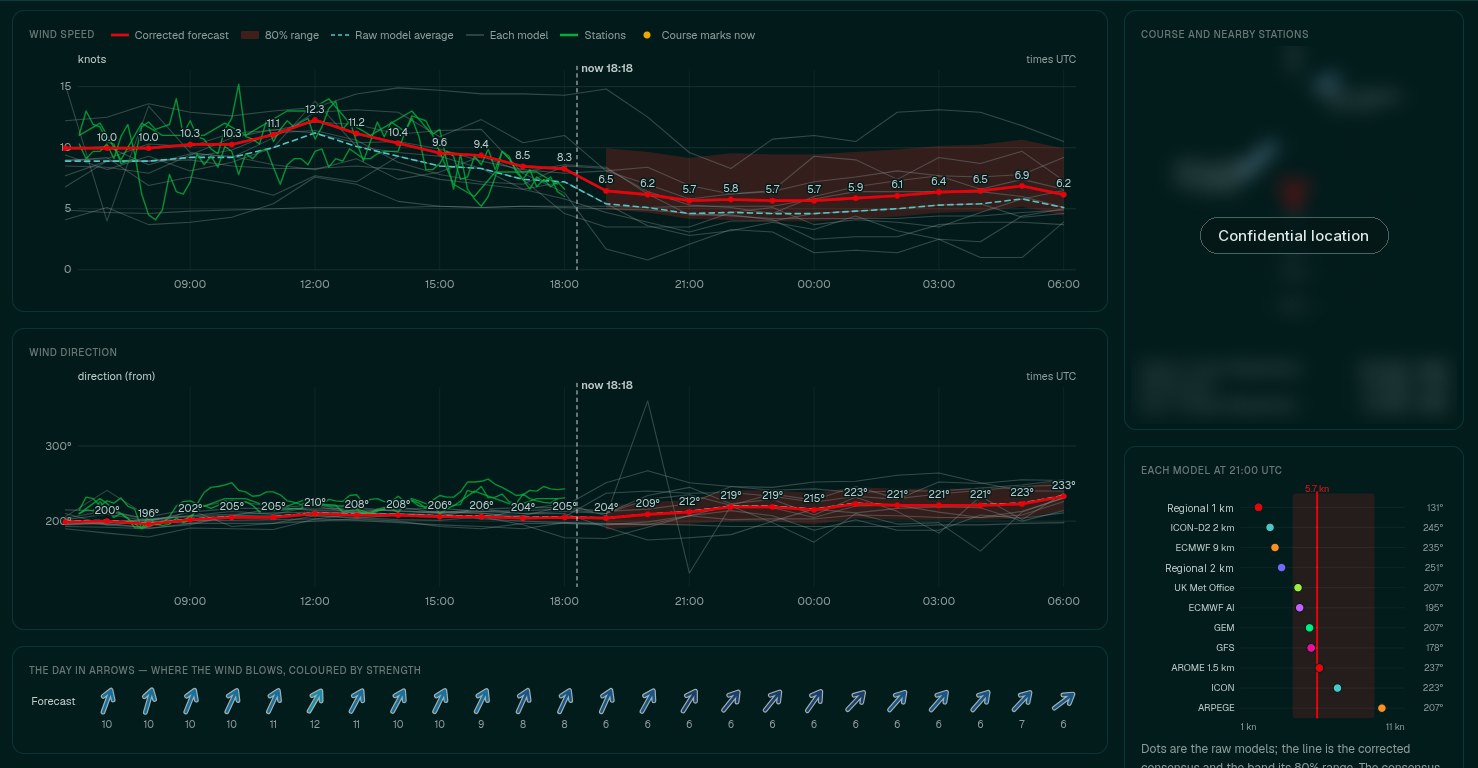
We built models that measure the progress lost during manoeuvres, rather than relying on boat speed alone. We combined these results with calibrated boat performance and reconstructed wind conditions to estimate faster routes around the course. Separate analysis covers start-line positioning, while wind forecasts are corrected against local weather stations and shown with their uncertainty.
3. Put the insight within reach
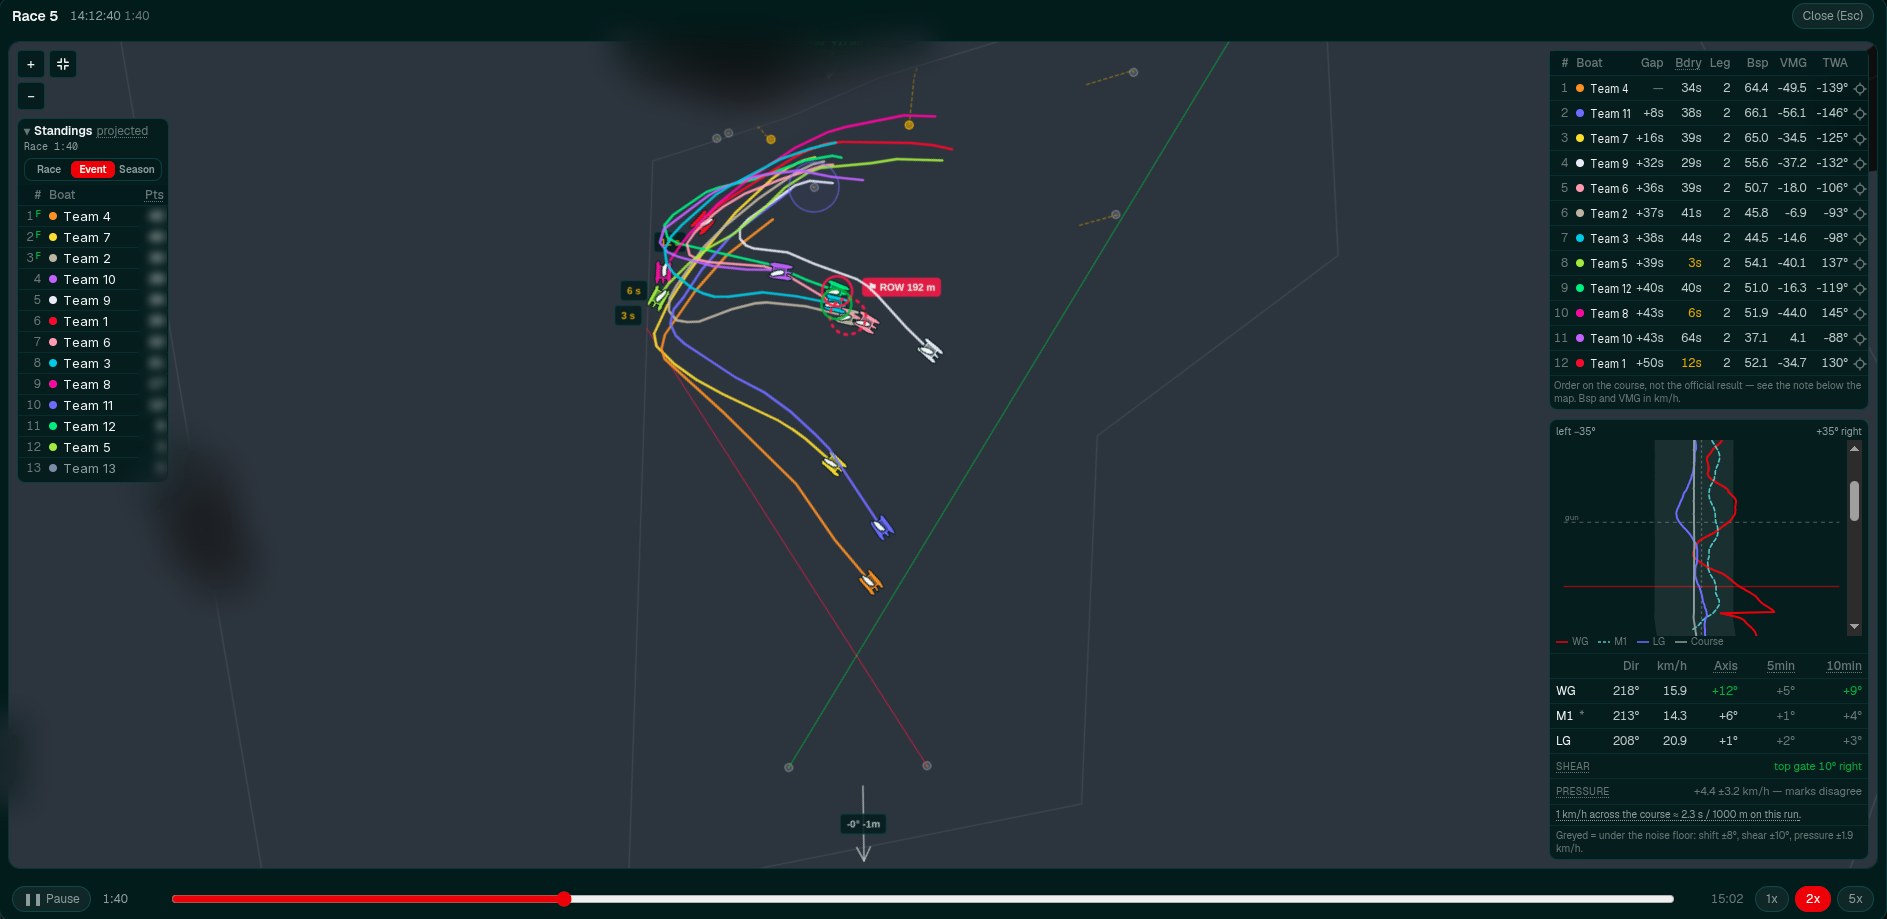
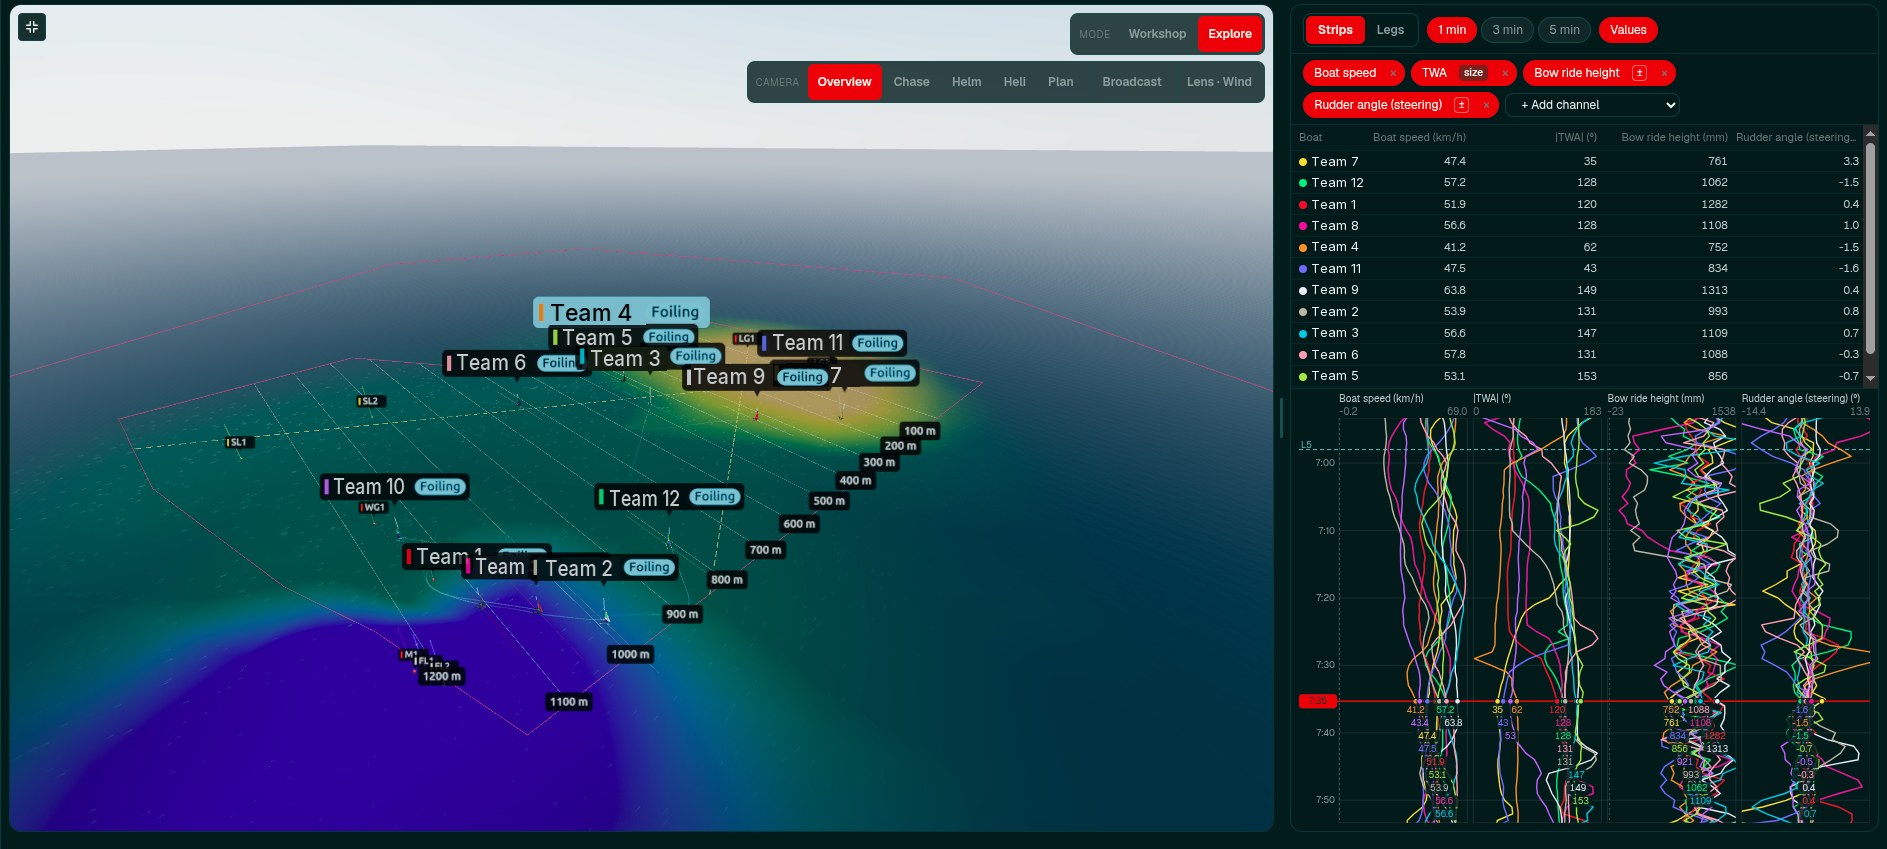
The dashboard brings the analysis to life through race replay, ideal-line comparisons and performance views. A multi-agent AI system connects questions to specialist tools for telemetry, race commentary and web research. Answers are summarised and linked back to their sources, so users can trace the reasoning rather than rely on an unsupported response.
Outcome
The result is a live platform used by sailors, coaches and analysts to explore performance and get sourced answers during debriefs and race weeks, without waiting for manual analysis. It continues to evolve through direct feedback from the people using it.
Facing a similar challenge?
A first conversation takes about 30 minutes and costs nothing.